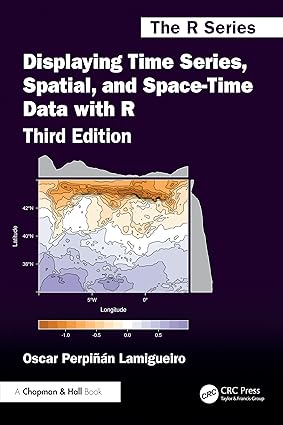
Displaying Time Series, Spatial, and Space-Time Data with R (Chapman & Hall/CRC The R Series)
Author(s): Oscar Perpinan Lamigueiro (Author)
- Publisher finelybook 出版社: Chapman and Hall/CRC
- Publication Date 出版日期: November 10, 2025
- Edition 版本: 3rd
- Language 语言: English
- Print length 页数: 294 pages
- ISBN-10: 1032776218
- ISBN-13: 9781032776217
Book Description
Focusing on the exploration of data with visual methods, “Displaying Time Series, Spatial, and Space-Time Data with R” presents methods and R code for producing high-quality static graphics, interactive visualizations, and animations, of time series, spatial, and space-time data. Practical examples using real-world datasets help you understand how to apply the methods and code.
While the first edition primarily focused on static graphics, and the second edition significantly expanded upon interactive elements, this edition has been thoroughly updated with a modern emphasis. Key enhancements include:
· Comprehensive updates to all chapters: Incorporating the latest advancements in packages like “sf” and “terra.”
· New content: Introducing valuable topics such as trajectories, hill shading, and cartograms, enriching the scope of the book.
The book illustrates how to display a dataset starting with an easy and direct approach and progressively adding improvements that involve more complexity. Each of the three parts of the book is devoted to different types of data. In each part, the chapters are grouped according to the various visualization methods or data characteristics.
Features
• Offers detailed information on producing high-quality graphics, interactive visualizations, and animations
• Uses real data from meteorological, climate, economic, social science, energy, engineering, environmental, and epidemiological research in many practical examples
• Shows how to improve graphics based on visualization theory
• Provides the graphics, data, and R code on the author’s website, enabling you to practice with the methods and modify the code to suit your own needs.
About the Author
Oscar Perpiñán-Lamigueiro is an Associate Professor at the Universidad Politécnica de Madrid, involved in teaching and research of Electrical Engineering, Electronics and Programming. He is also a lecturer of Photovoltaic and Solar Energy at the Escuela de Organización Industrial. He holds a Master’s Degree in Telecommunications Engineering and a PhD in Industrial Engineering. At present, his research focuses on solar radiation (forecasting, spatial interpolation, open data) and software development with R (packages rasterVis, solaR, meteoForecast, PVF, tdr). https://www.routledge.com/authors/i2144-oscar-perpin-lamigueiro
 finelybook
